

Key Takeaways
Investment Fee Drag
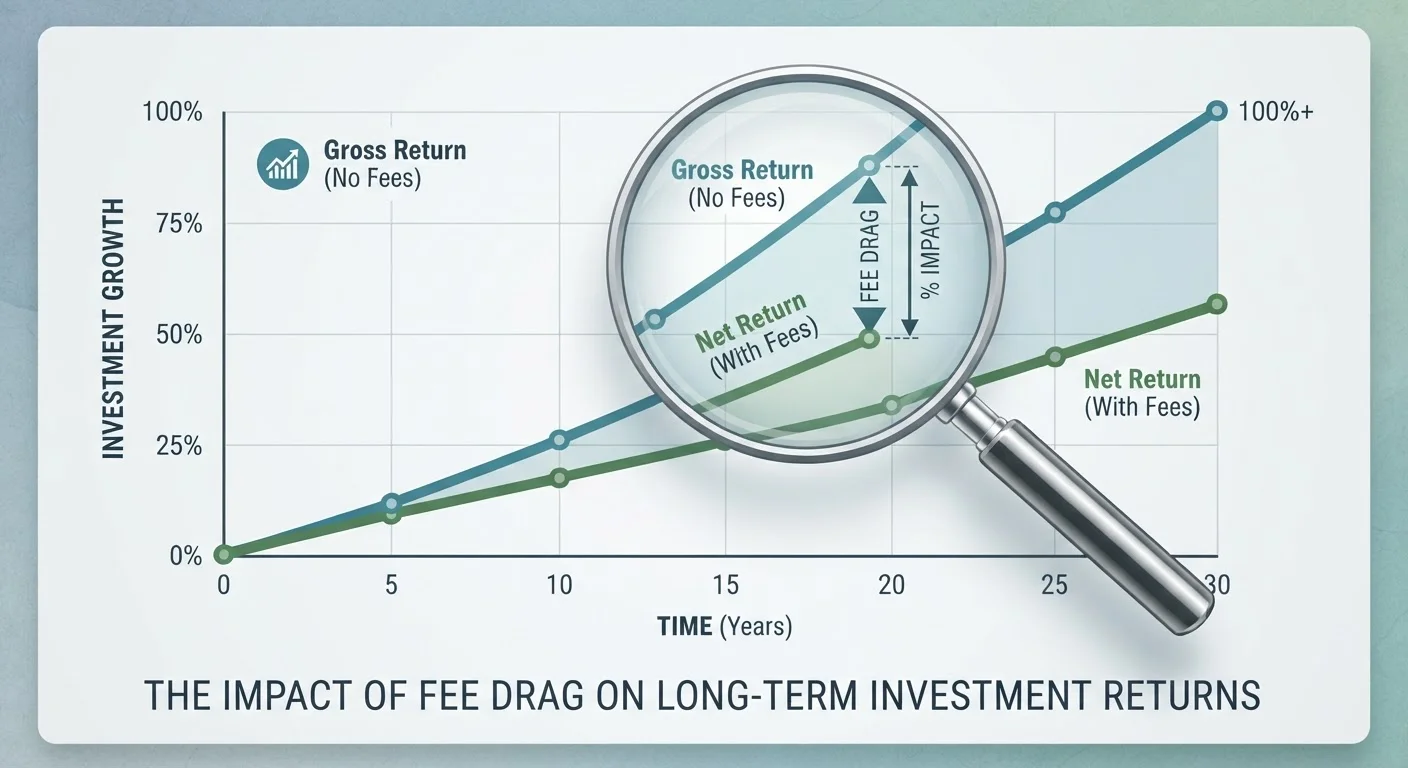
Investment fee drag is the reduction in your portfolio's long-term growth caused by ongoing fees charged by funds, brokers, or advisers. These fees are usually expressed as a percentage of your assets each year - called an expense ratio - and are deducted automatically, often without a visible line item on your statement. Because fees reduce the amount that compounds over time, their true cost grows far larger than the stated percentage suggests.
Fee drag is mathematically equivalent to a permanent reduction in your annualized return. A portfolio earning 7% gross with a 1% annual fee delivers the same ending balance as a fee-free portfolio earning 6% - the compounding effect of that 1% difference widens every year the money remains invested.
Why a Small Percentage Is Never Really Small
When you look at a fund charging 1% per year, the number looks inconsequential. One percent. That's ten dollars on a thousand. But that framing misses the mechanism that makes fees so damaging over time: compounding.
To understand fee drag, you first need to understand that compounding works symmetrically - it amplifies both growth and loss. Every dollar paid in fees today is not just a dollar gone. It's also every dollar that dollar would have earned over the next decade or more. This is sometimes called the opportunity cost of fees, and it's the number that rarely appears on any statement.
If you haven't yet read our explainer on how compounding works, it's worth starting there: compound interest and why it matters early. Once you understand that concept, fee drag becomes immediately intuitive.
~$19,000
Lost to a 1% fee over 30 years
Illustrative calculation: $10,000 invested at 7% gross for 30 years yields ~$76,000; a 1% annual fee reducing net return to 6% yields ~$57,000 - a gap of roughly $19,000.
0.03%-0.20%
Typical expense ratio for broad index funds
Many widely used passive index funds disclose expense ratios in this range in their prospectuses, compared to 0.50%-1.50% for many actively managed funds.
1%
Common annual financial adviser fee
A fee-only adviser charging 1% of assets under management annually is a common benchmark, though fees vary widely by adviser and services provided.
The Three Main Types of Investment Fees
Not all fees work the same way. Knowing where costs come from helps you evaluate what you're actually paying for.
- Expense ratios: Charged annually by mutual funds and ETFs as a percentage of assets under management. They are deducted from the fund's return before it's reported to you, making them effectively invisible unless you look them up.
- Adviser or management fees: Charged by financial advisers or robo-advisers, typically as an annual percentage of your portfolio. These are separate from the underlying funds' expense ratios - you may be paying both simultaneously.
- Transaction or trading costs: These include commissions on trades (now eliminated by many brokerages for standard stock and ETF trades) and bid-ask spreads, which are the small difference between the price you pay to buy and the price you'd receive to sell.
The total cost you carry is the sum of all active fees. A fund with a 0.75% expense ratio held through an adviser charging 0.80% means you're paying 1.55% annually before your money grows a dollar.
Where to Find a Fund's Expense Ratio
Every registered mutual fund and ETF in the US is required to disclose its expense ratio in its prospectus and on its fund fact sheet. You can typically find this information on the fund provider's website or through financial data aggregators. Look for the line labeled 'Annual Fund Operating Expenses' or 'Net Expense Ratio' - these are the figures that matter for ongoing cost comparisons.
Running the Numbers: Two Investors, One Difference
Consider two investors who each put $15,000 into a diversified portfolio at age 25 and make no additional contributions. Both portfolios earn 7% gross annually. Investor A pays 0.10% in annual fees (net return: 6.90%). Investor B pays 1.10% in annual fees (net return: 5.90%).
After 35 years, at age 60:
- Investor A ends with approximately $152,000.
- Investor B ends with approximately $107,000.
The difference - roughly $45,000 - is entirely attributable to a 1% annual fee gap. Neither investor made different investment decisions, took different risks, or contributed different amounts. The only variable was cost. These are illustrative projections; actual market returns and outcomes vary and cannot be guaranteed.
This dynamic is also why building sound investing habits early matters so much: the longer the time horizon, the wider the fee-drag gap becomes.
Active vs. Passive Funds: Where Fees Diverge Most
Actively managed funds employ portfolio managers who research, select, and trade securities in an attempt to outperform a benchmark index. This work costs money, which is reflected in higher expense ratios - often between 0.50% and 1.50% annually, sometimes higher.
Passively managed index funds, by contrast, simply track a market index mechanically. Their lower operational complexity translates into significantly lower expense ratios, often below 0.20% and sometimes below 0.05%.
Research from multiple academic sources has consistently found that, after fees, the majority of actively managed funds underperform their benchmark index over long periods. This doesn't mean active management never adds value - it means the fee hurdle is real and must be cleared before any net benefit materialises. It's a useful counterpoint to the common investing myth that paying more for management automatically means better results.
This article is for general informational and educational purposes only and does not constitute personalised financial or investment advice. Consider consulting a licensed financial professional before making decisions about your own investments.
“Costs matter in investing. If returns are 7% and you pay 2% in fees, you're giving up almost 30% of your potential wealth creation. Fund costs are one of the most reliable predictors of future net returns - lower costs have historically been associated with better investor outcomes.”
— John C. Bogle, Founder of Vanguard and pioneer of low-cost index fund investing